Ritrova la tua luce
naturale.
Consulenza personalizzata di benessere olistico e integrazione nutrizionale scientifica con le linee premium Partner.Co. Disegna uno stile di vita leggero, attivo e rigenerato.

Gocce Giorno & Notte
Best SellerVináli™
Pelle & Difese


Qualificata
A 50 anni ho scelto di ricominciare.
Ciao! Sono Romina. Sono una donna e una mamma di due figli che, a 50 anni, ha scelto di mettersi in gioco e iniziare un nuovo percorso nel benessere e nel Partnership Marketing.
Pancia gonfia, stanchezza cronica e zero energie... io ci sono passata. Ho scelto di cambiare partendo da piccoli passi: un'alimentazione sana e la giusta integrazione di altissima qualità. Questo percorso mi ha permesso di stare finalmente bene con me stessa ed accendere il cuore.
Amo la moda, la cucina fit e la bellezza delle piccole cose perché sono una romanticona. Sto costruendo una nuova versione di me, un passo alla volta. Oggi accompagno con fiducia chi desidera stare meglio, sentirsi più energico e, per chi lo desidera, costruirsi un'entrata extra facendo ciò che ama.
La Scelta
Affronto stanchezza e gonfiore. Scopro l'integrazione Partner.Co.
Manager Rank
Raggiungimento del rank Manager e coordinamento del team.
Programma Body Balance:
risultati reali.
"Se pensi che servano mesi per stare meglio, ti sembrerà sempre troppo difficile iniziare. Ma se pensi a 28 giorni, diventano solo 28 piccoli passi. Il cambiamento occupa il tempo che gli concedi: più lo rimandi, più ti sembra grande e impossibile."
Inizi oggi. E tra 28 giorni potresti sentirti diversa, più leggera, più forte. Il programma Body Balance si basa sulla sinergia tra alimentazione sana, esercizio fisico moderato e l'integrazione d'eccellenza delle nostre gocce e dei nostri shake biologici.
Persone vere, risultati veri!
Oltre la bilancia: ritrovare l'energia e sgonfiare la pancia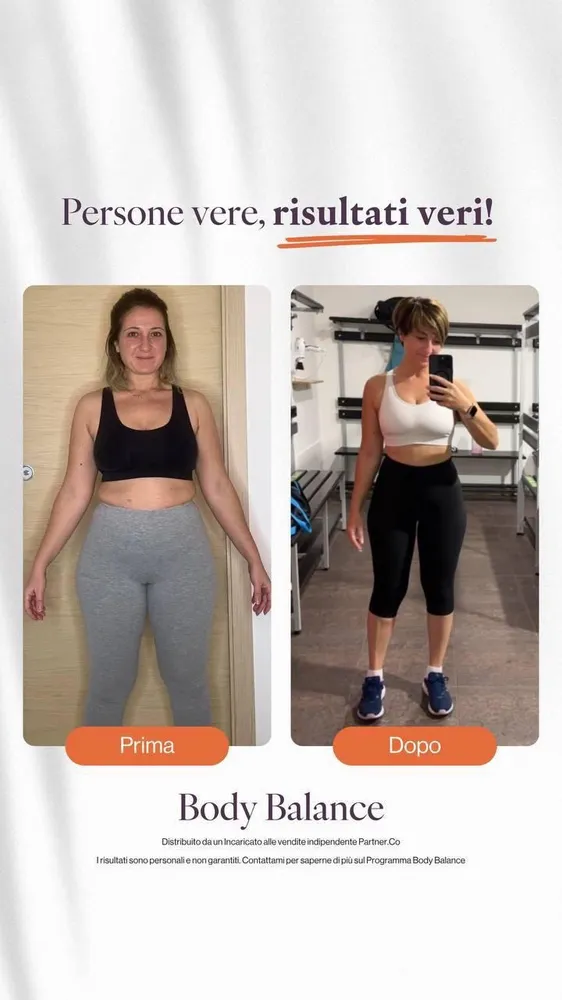

*Disclaimer: I risultati sono soggettivi e dipendono da uno stile di vita personale. Studi clinici hanno dimostrato che i partecipanti al Sistema Body Balance hanno perso da 4 a 8 kg in 28 giorni a seconda di come si segue il programma che include una corretta alimentazione ed esercizio fisico. #incaricatoallevenditepartnerco
Le 3 Fasi del Programma
Guida Esclusiva VIP: I dettagli operativi delle 3 Fasi (Reset, Esercizio e Mantenimento) sono riservati. L'accesso completo e non censurato al protocollo Body Balance è riservato in esclusiva ai clienti che utilizzano le Gocce Day & Night, per garantire un percorso personalizzato e supportato.
Acquista Kit & Sblocca GuidaAlimenti & Menù Consigliati
Guida Esclusiva VIP: La lista completa degli alimenti approvati, dei cibi da evitare e dei menù giornalieri di esempio è riservata. L'accesso completo e non censurato al protocollo Body Balance è riservato in esclusiva ai clienti che utilizzano le Gocce Day & Night, per garantire un percorso personalizzato e supportato.
Acquista Kit & Sblocca GuidaMisurazioni di Successo
Guida Esclusiva VIP: Il tracker dei centimetri (Peso, Collo, Busto, Bicipite, Vita, Fianchi) e lo schema dettagliato di integrazione consigliata sono riservati. L'accesso completo e non censurato al protocollo Body Balance è riservato in esclusiva ai clienti che utilizzano le Gocce Day & Night, per garantire un percorso personalizzato e supportato.
Acquista Kit & Sblocca Guida8 Segnali che indicano
un corpo infiammato.
Spesso il gonfiore, la ritenzione e la stanchezza al risveglio non dipendono dalle calorie, ma da uno stato di infiammazione silente e microcircolo rallentato. Riconosci questi segnali nel tuo corpo?
Ti gonfi ogni sera anche se mangi poco
Spia di fermentazione intestinale, digestione lenta e accumulo di tossine.
Carboniix™
Carbone vegetale attivo e spirulina per catturare le tossine e sgonfiare l'addome.
La cellulite peggiora anche se ti alleni
Tessuti congestionati e ristagno di tossine nei setti fibrosi cutanei.
Vináli™
Estratto di semi d'uva e bioflavonoidi per favorire il microcircolo e l'elasticità della pelle.
Hai il segno del calzino a fine giornata
Segnale di sistema linfatico rallentato, ritenzione idrica e gonfiore delle caviglie.
Vináli™ + Max₂O™ + Noni Original
La combinazione ideale per favorire il drenaggio dei liquidi ed il benessere linfatico.
Il tuo intestino è lento o irregolare
Infiammazione del colon e alterazione della flora batterica intestinale.
Carboniix™ + Culturiix™
Azione detox del carbone attivo abbinata a 15 ceppi di probiotici vivi per riequilibrare l'intestino.
Ti senti stanca anche dopo aver dormito
Infiammazione silente che altera il riposo profondo e i livelli di cortisolo.
Renew™
Supporto naturale ai ritmi circadiani e alla rigenerazione cellulare notturna.
Il peso non scende nonostante dieta e sport
Blocco metabolico indotto da stress cellulare ed elevato carico infiammatorio.
Gocce Giorno & Notte
Due miscele innovative per sbloccare il metabolismo e ridurre la fame nervosa.
Necessiti di continuo caffè per l'energia?
Spia di stanchezza mentale, affaticamento intellettuale e nebbia cognitiva.
Rejuveniix™
Superfrutti e caffeina naturale per aumentare l'attenzione e darti energia costante.
Non hai tempo per mangiare sano?
Pasti saltati, fretta e alimentazione disordinata che caricano il corpo di stress metabolico.
PureNourish™ Natural
Proteine vegetali purissime arricchite con fibre prebiotiche per un pasto sano, nutriente e veloce.
8 Segnali che indicano
un corpo infiammato.
Spesso il gonfiore, la ritenzione e la stanchezza al risveglio non dipendono dalle calorie, ma da uno stato di infiammazione silente e microcircolo rallentato. Riconosci questi segnali nel tuo corpo?
Ti gonfi ogni sera anche se mangi poco
Spia di fermentazione intestinale, digestione lenta e accumulo di tossine.
Carboniix™
Carbone vegetale attivo e spirulina per catturare le tossine e sgonfiare l'addome.
La cellulite peggiora anche se ti alleni
Tessuti congestionati e ristagno di tossine nei setti fibrosi cutanei.
Vináli™
Estratto di semi d'uva e bioflavonoidi per favorire il microcircolo e l'elasticità della pelle.
Hai il segno del calzino a fine giornata
Segnale di sistema linfatico rallentato, ritenzione idrica e gonfiore delle caviglie.
Vináli™ + Max₂O™ + Noni Original
La combinazione ideale per favorire il drenaggio dei liquidi ed il benessere linfatico.
Il tuo intestino è lento o irregolare
Infiammazione del colon e alterazione della flora batterica intestinale.
Carboniix™ + Culturiix™
Azione detox del carbone attivo abbinata a 15 ceppi di probiotici vivi per riequilibrare l'intestino.
Ti senti stanca anche dopo aver dormito
Infiammazione silente che altera il riposo profondo e i livelli di cortisolo.
Renew™
Supporto naturale ai ritmi circadiani e alla rigenerazione cellulare notturna.
Il peso non scende nonostante dieta e sport
Blocco metabolico indotto da stress cellulare ed elevato carico infiammatorio.
Gocce Giorno & Notte
Due miscele innovative per sbloccare il metabolismo e ridurre la fame nervosa.
Necessiti di continuo caffè per l'energia?
Spia di stanchezza mentale, affaticamento intellettuale e nebbia cognitiva.
Rejuveniix™
Superfrutti e caffeina naturale per aumentare l'attenzione e darti energia costante.
Non hai tempo per mangiare sano?
Pasti saltati, fretta e alimentazione disordinata che caricano il corpo di stress metabolico.
PureNourish™ Natural
Proteine vegetali purissime arricchite con fibre prebiotiche per un pasto sano, nutriente e veloce.